This page will teach you how to color lines and other shapes, as well as text in the Feynman diagrams produced with the feynmp package in LaTeX. Have a look at the “color” tag to see examples of diagrams with color.
Line & shape colors
To color specific line, simply add the following style option
foreground=(❬red❭,,❬green❭,,❬blue❭)
to \fmf for lines or \fmfv for other shapes. You need two commas instead of one so the parser does not get confused between style options. You can abbreviate to
f=(❬red❭,,❬green❭,,❬blue❭).
You specify the color with its normalized RGB code. You can use many online tools like this RGB color picker to find the RGB code for the color you want. Some examples of normalized RGB codes:
foreground=(0,,0,,0)is purely black, corresponding to (0,0,0).foreground=(1,,1,,1)is purely white, corresponding to (255,255,255).foreground=(1,,0,,0)is purely red, corresponding to (255,0,0).foreground=(0,,1,,0)is purely green, corresponding to (0,255,0).foreground=(0,,0,,1)is purely blue, corresponding to (0,0,255).foreground=(0,,0,,0.6)is dark blue, corresponding to (0,0,153).foreground=(0.8,,0.8,,1)is light blue, corresponding to (204,204,255).foreground=(1,,0.5,,0)is orange, corresponding to (255,128,0).
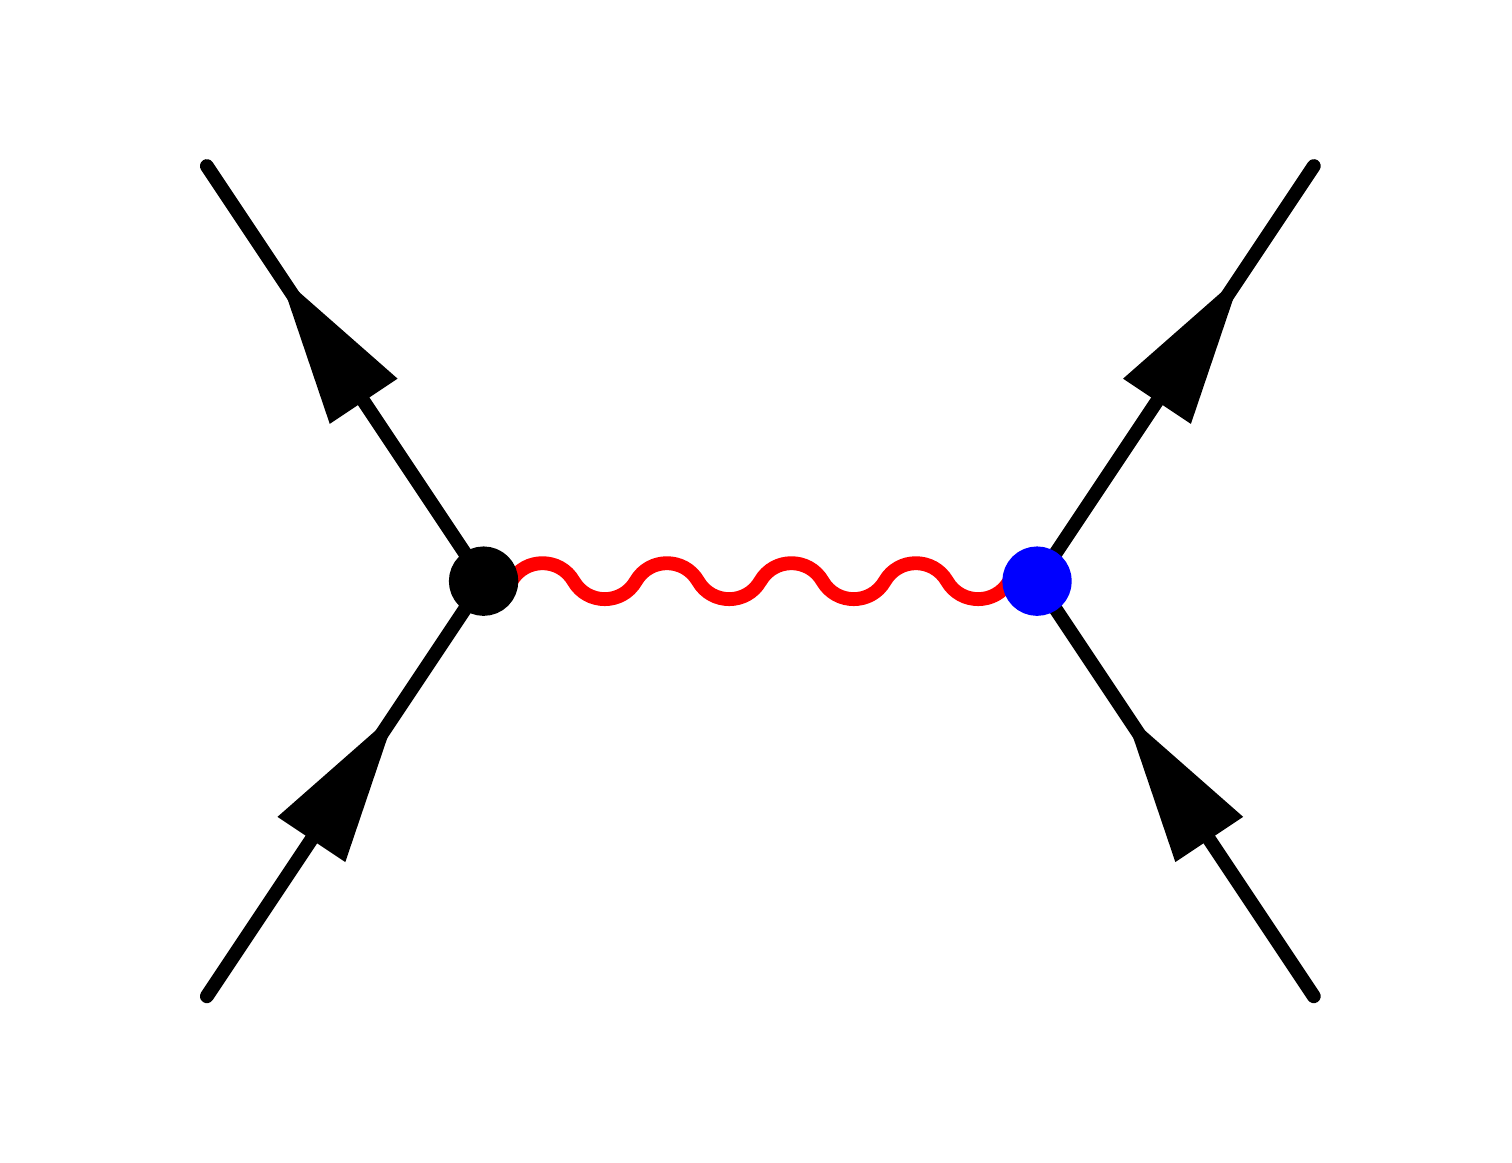
For example:
\documentclass[11pt,border=2pt]{standalone}
\usepackage{feynmp-auto}
\begin{document}
\begin{fmffile}{feyngraph}
  \begin{fmfgraph*}(100,60) % dimensions (WH)
    \fmfleft{i2,i1}
    \fmfright{o2,o1}
    \fmf{fermion}{i2,v1,i1}
    \fmf{boson,foreground=(1,,0,,0)}{v1,v2} % red line
    \fmf{fermion}{o2,v2,o1}
    \fmfv{decor.shape=circle,decor.filled=full,
          decor.size=4}{v1}
    \fmfv{decor.shape=circle,decor.filled=full,
          decor.size=4,foreground=(0,,0,,1)}{v2} % blue point
  \end{fmfgraph*}
\end{fmffile}
\end{document}
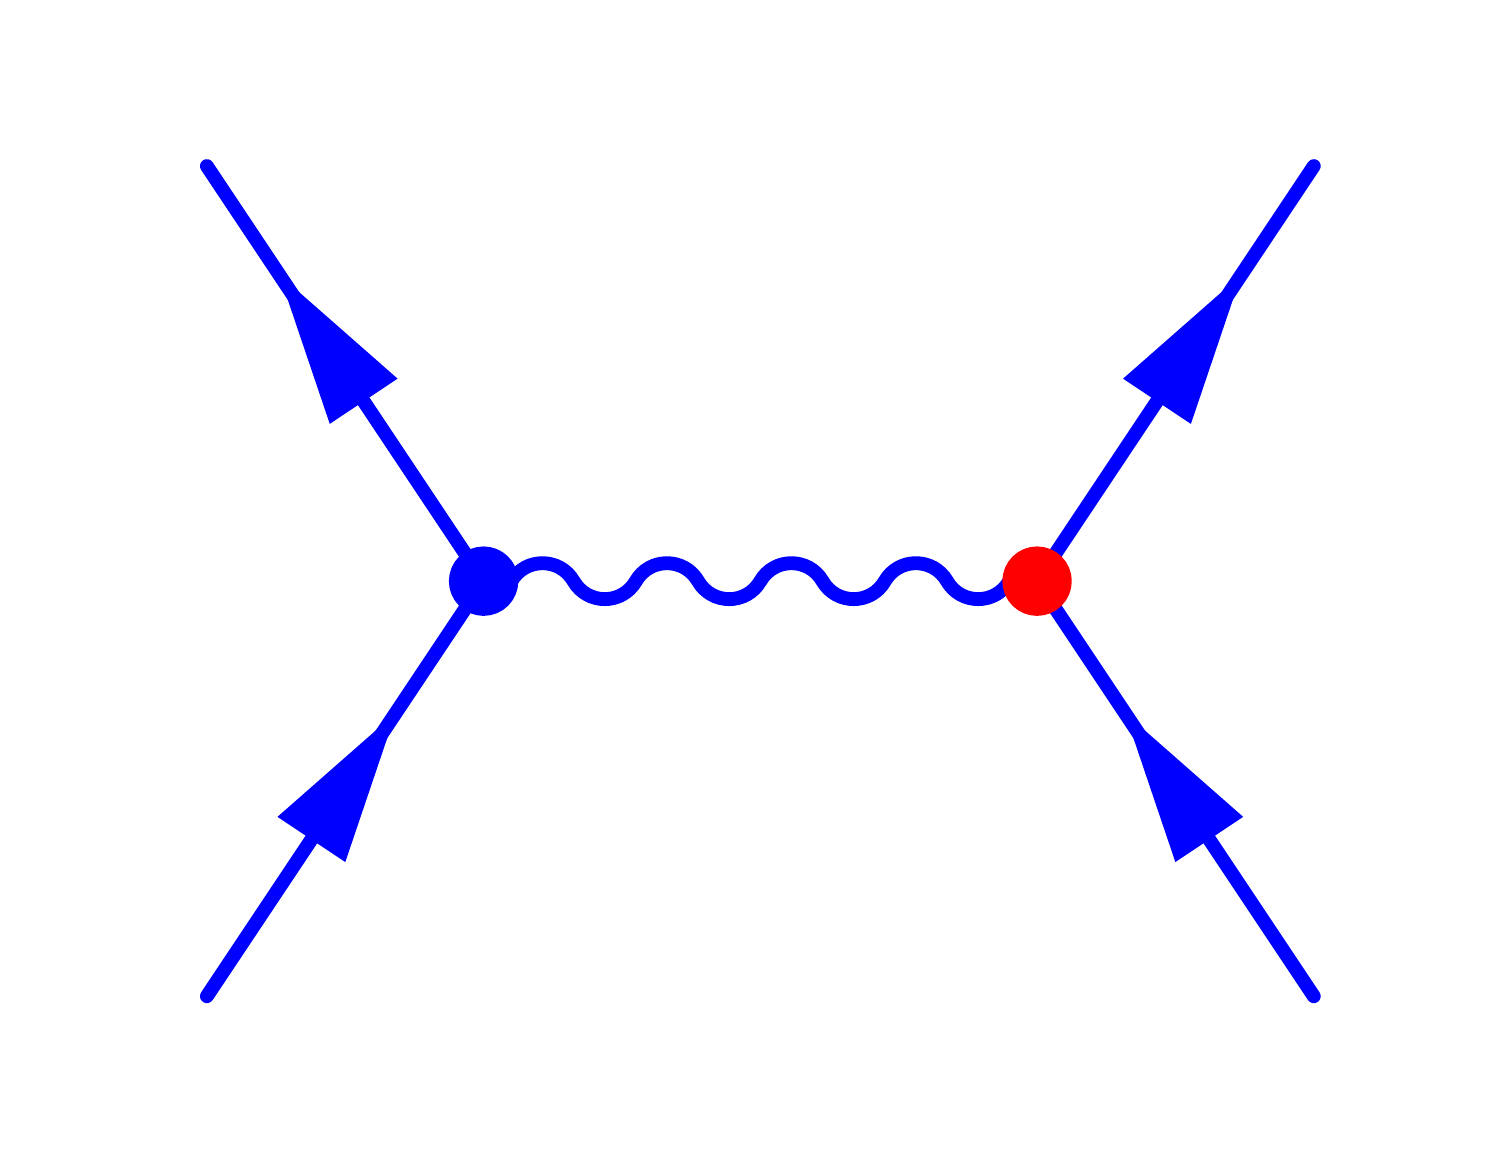
The default line and shape color is black. To change the default color for all lines, you can do
\fmfcmd{foreground := (❬red❭,❬green❭,❬blue❭);}
which changes set the global foreground variable in MetaPost, where the Feynman diagrams are constructed. This time you do not need two commas.
\documentclass[11pt,border=2pt]{standalone}
\usepackage{feynmp-auto}
\begin{document}
\begin{fmffile}{feyngraph}
  \fmfcmd{foreground:=(0,0,1);} % set blue as default line/shape color
  \begin{fmfgraph*}(100,60) % dimensions (WH)
    \fmfleft{i2,i1}
    \fmfright{o2,o1}
    \fmf{fermion}{i2,v1,i1}
    \fmf{boson}{v1,v2}
    \fmf{fermion}{o2,v2,o1}
    \fmfv{decor.shape=circle,decor.filled=full,
          decor.size=4}{v1}
    \fmfv{decor.shape=circle,decor.filled=full,
          decor.size=4,foreground=(1,,0,,0)}{v2} % override default foreground
  \end{fmfgraph*}
\end{fmffile}
\end{document}
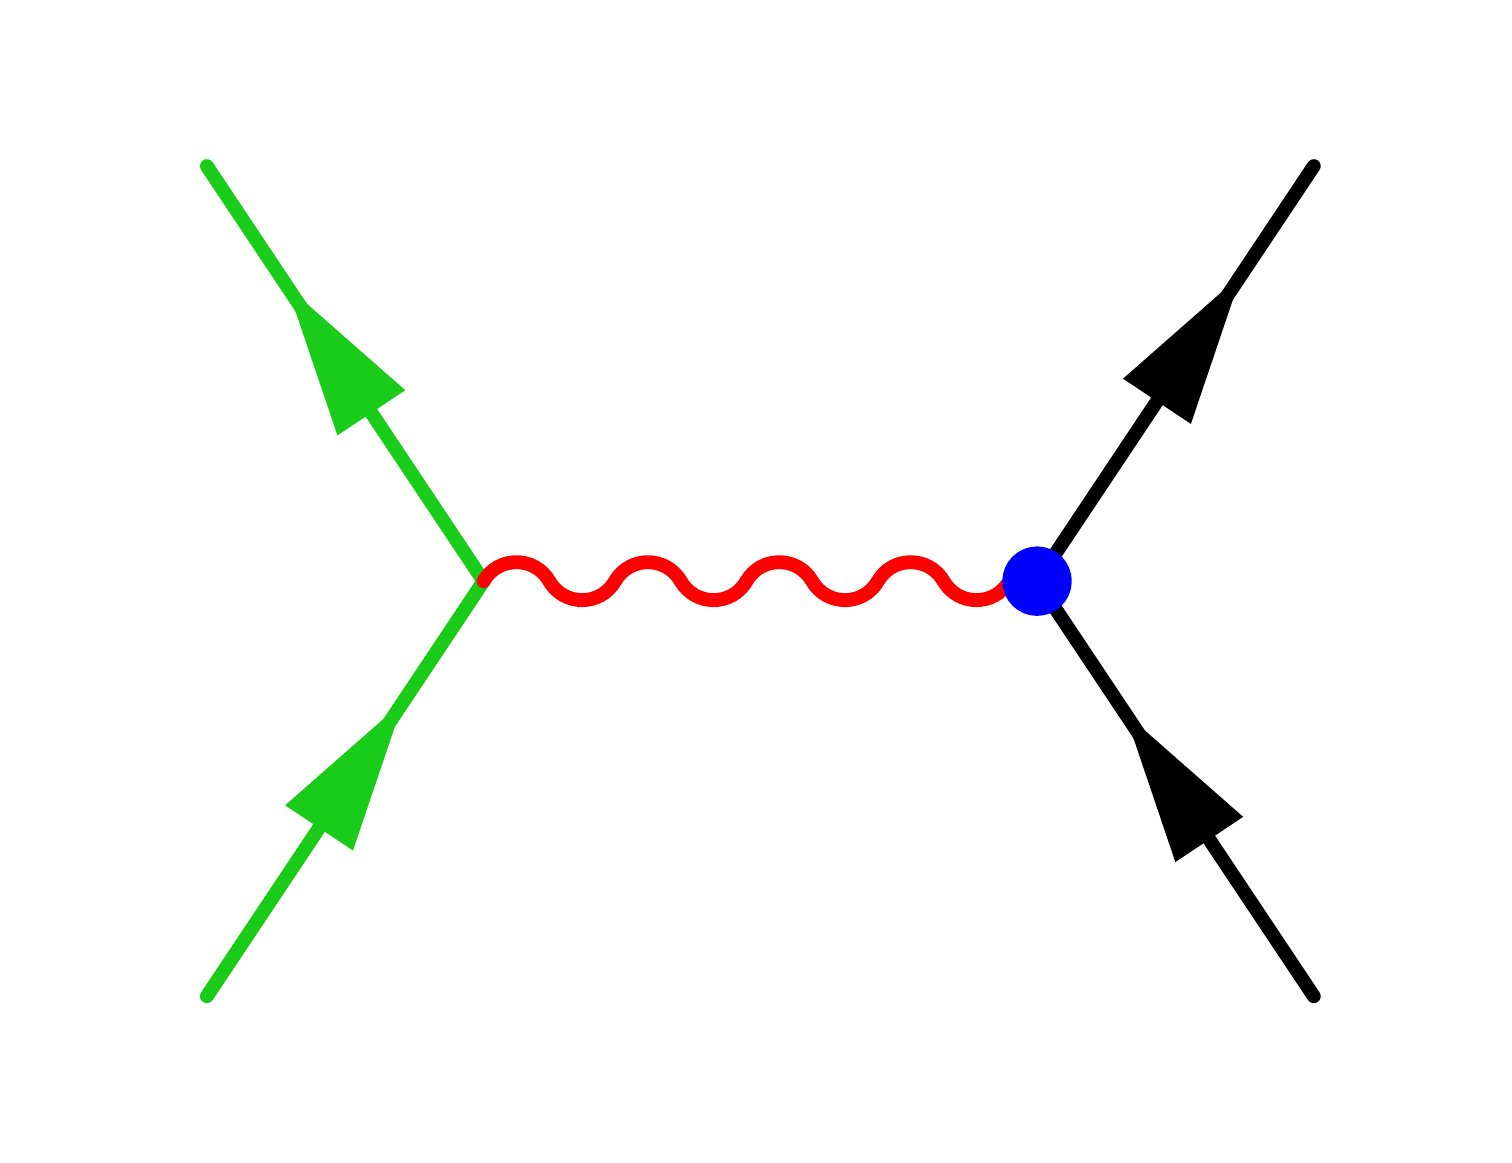
You can predefine your own named colors in MetaPost using
\fmfcmd{color ❬colorname❭; ❬colorname❭ := f(❬red❭,❬green❭,❬blue❭);}.
Then you can pass it to the foreground style option instead of a normalized RGB code:
\documentclass[11pt,border=2pt]{standalone}
\usepackage{feynmp-auto}
\begin{document}
\begin{fmffile}{feyngraph}
  \fmfcmd{ % define custom named colors
    color myred; myred := (1,0,0);
    color myblue; myblue := (0,0,1);
    color mygreen; mygreen := (0.1,0.8,0.1);
  }
  \begin{fmfgraph*}(100,60) % dimensions (WH)
    \fmfleft{i2,i1}
    \fmfright{o2,o1}
    \fmf{fermion,f=mygreen}{i2,v1,i1}
    \fmf{boson,f=myred}{v1,v2}
    \fmf{fermion}{o2,v2,o1}
    \fmfv{d.sh=circle,d.si=4,f=myblue}{v2}
  \end{fmfgraph*}
\end{fmffile}
\end{document}
Text colors
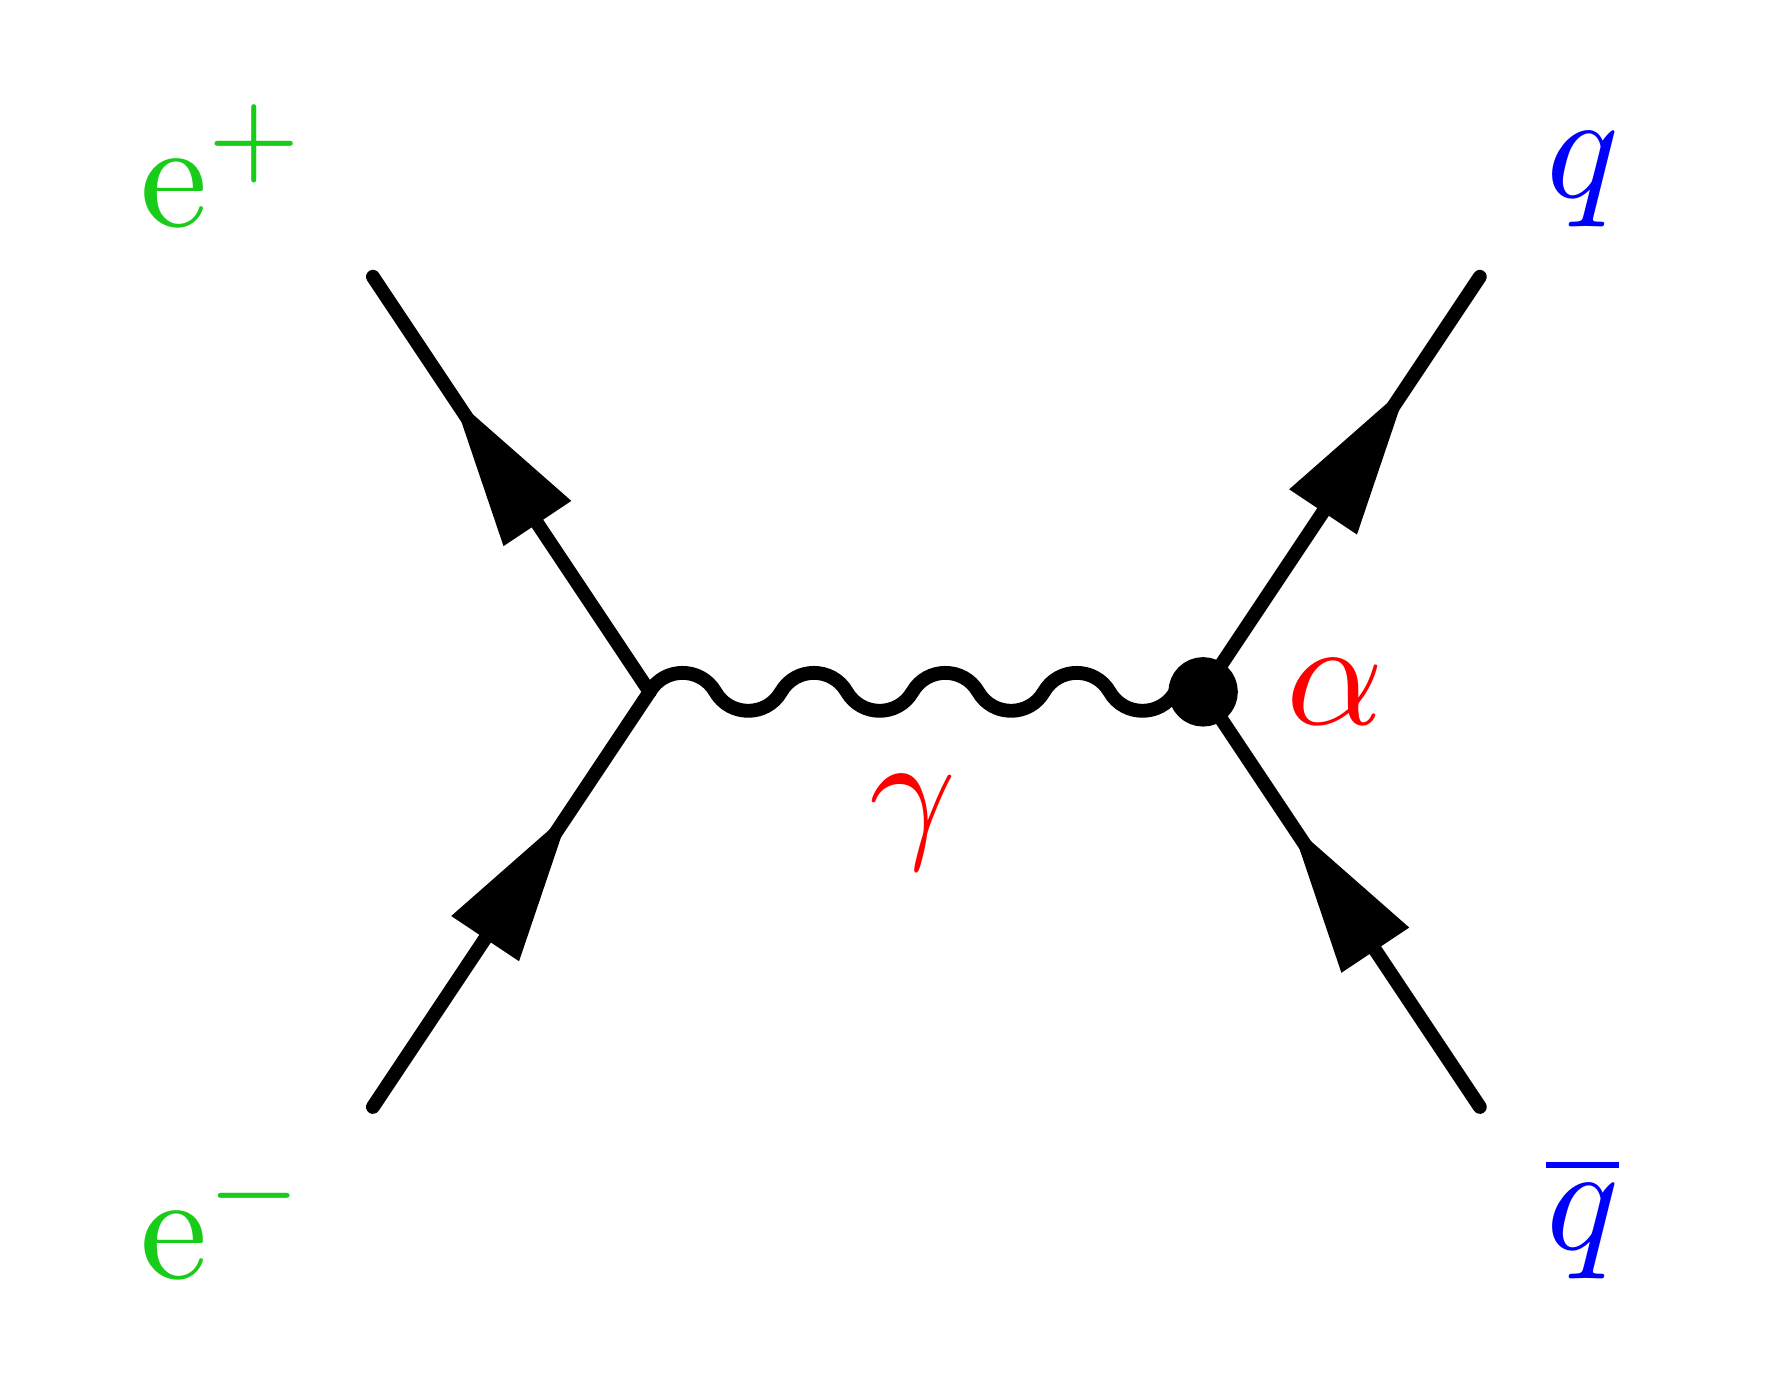
To set text color, you can use the xcolor LaTeX package. There are several ways to define the color, and you can find several excellent tutorials on this Wikibooks page, or this Overleaf page. To use it in Feynman diagrams, simply add it before the text you want to write via the label style option:
\documentclass[11pt,border=2pt]{standalone}
\usepackage{feynmp-auto}
% COLORS
\usepackage{xcolor} % for \definecolor & \color
\definecolor{myred}{rgb}{1,0,0} % red
\definecolor{myblue}{rgb}{0,0,1} % blue
\definecolor{mygreen}{rgb}{0.1,0.8,0.1} % green
\begin{document}
\fmfframe(6,18)(2,18){ % padding (LT)(RB)
\begin{fmffile}{feyngraph}
\begin{fmfgraph*}(100,60) % dimensions (WH)
\fmfleft{i2,i1}
\fmfright{o2,o1}
\fmf{fermion}{i2,v1,i1}
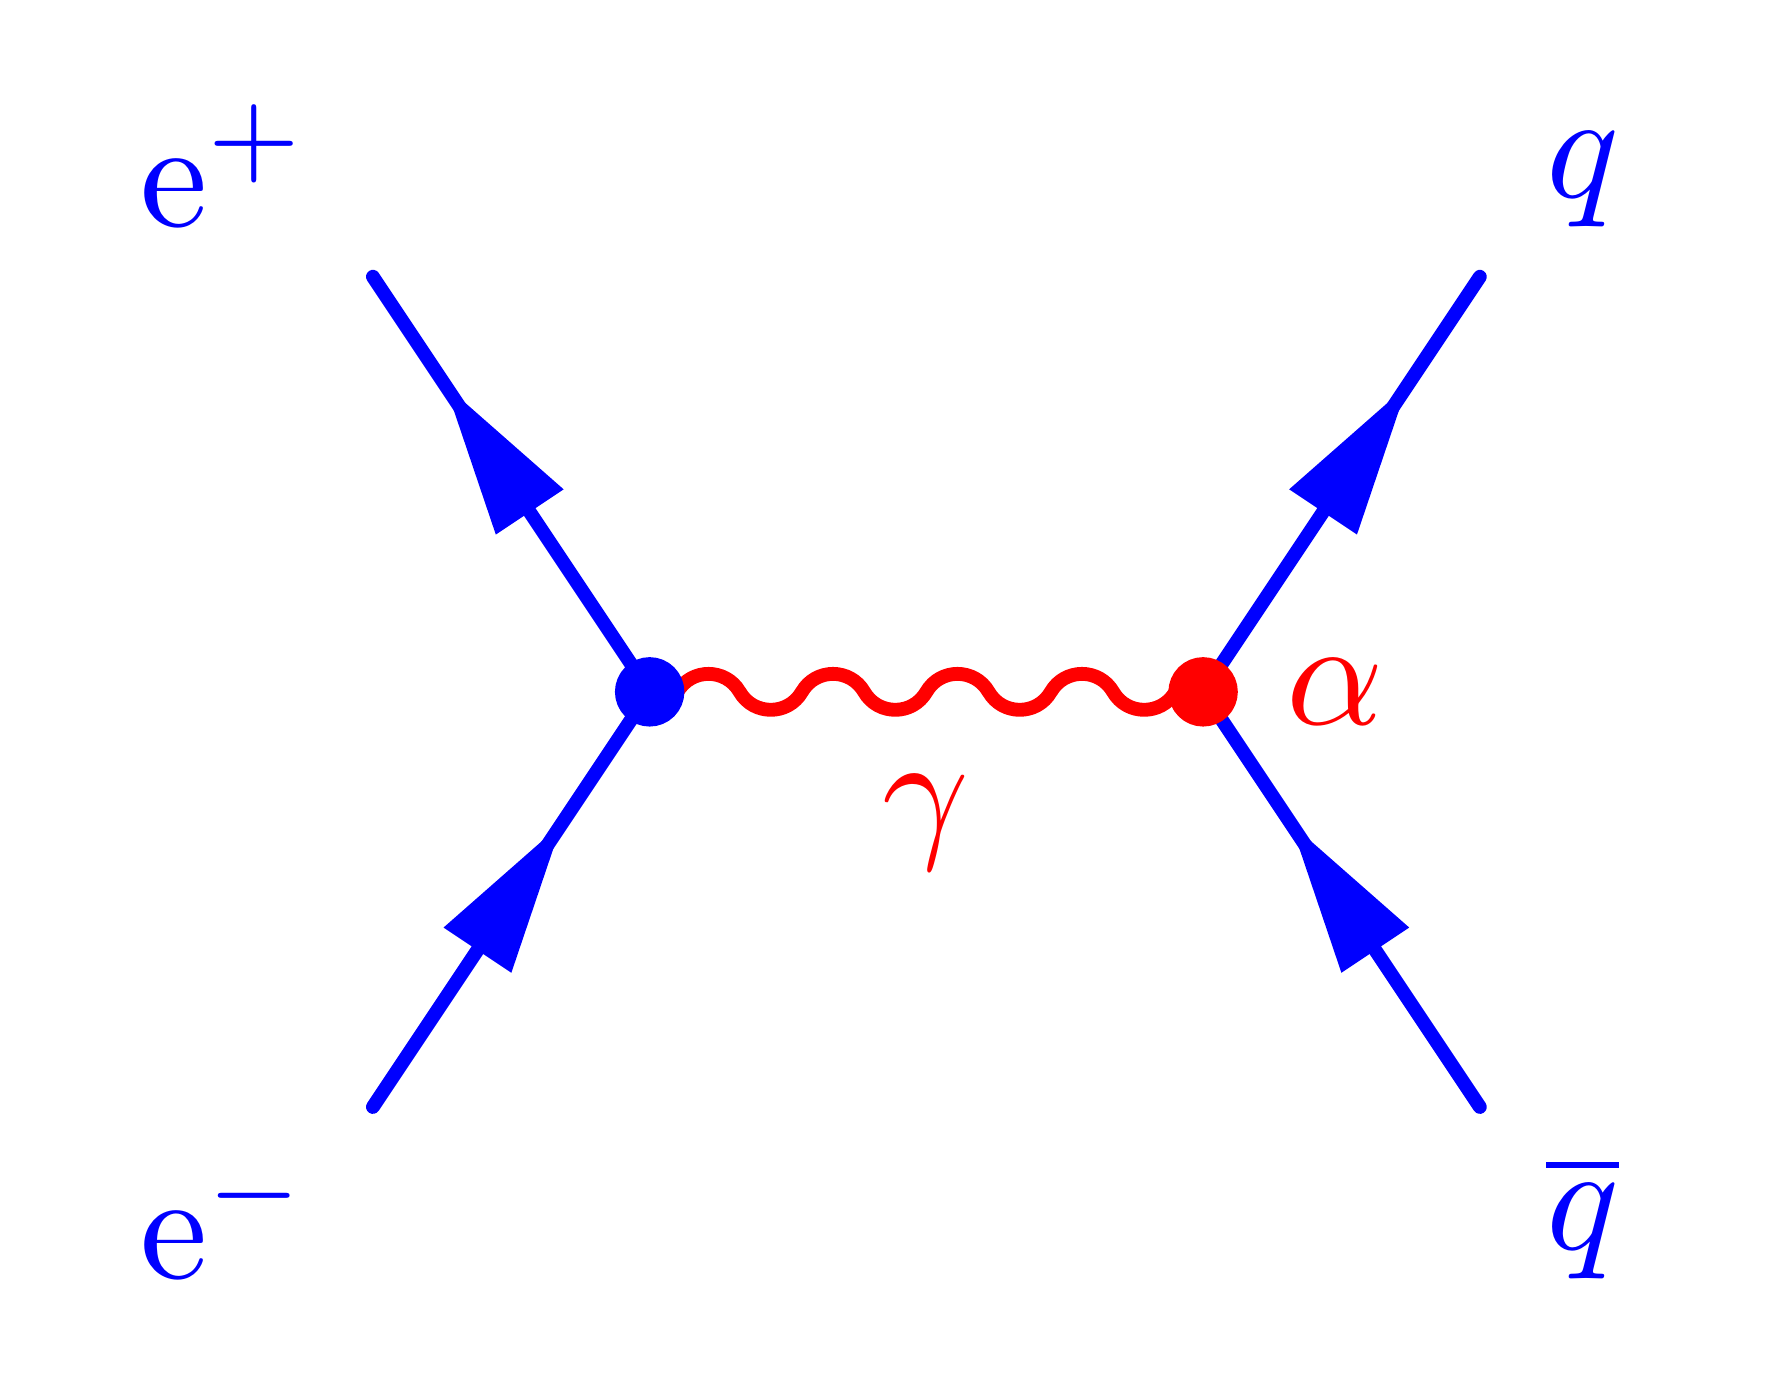
\fmf{boson,label=\color{myred}$\gamma$}{v1,v2}
\fmf{fermion}{o2,v2,o1}
\fmfv{d.sh=circle,d.si=4,
label=\color{myred}$\alpha$}{v2}
\fmflabel{\color{mygreen}e$^+$}{i1}
\fmflabel{\color{mygreen}e$^-$}{i2}
\fmflabel{\color{myblue}$q$}{o1}
\fmflabel{\color{myblue}$\overline{q}$}{o2}
\end{fmfgraph*}
\end{fmffile}
} % close \fmfframe
\end{document}
You can change the default color of all text in the picture by calling \color just before \begin{fmfgraph}:
\documentclass[11pt,border=2pt]{standalone}
\usepackage{feynmp-auto}

% COLORS
\usepackage{xcolor} % for \definecolor & \color
\definecolor{myred}{rgb}{1,0,0} % red
\definecolor{myblue}{rgb}{0,0,1} % blue
\definecolor{mygreen}{rgb}{0.1,0.8,0.1} % green

\begin{document}
\fmfframe(6,18)(2,18){ % padding (LT)(RB)
\begin{fmffile}{feyngraph}
  \color{myblue} % set blue as default text color
  \fmfcmd{foreground:=(0,0,1);} % set blue as default line/shape color
  \begin{fmfgraph*}(100,60) % dimensions (WH)
    \fmfleft{i2,i1}
    \fmfright{o2,o1}
    \fmf{fermion}{i2,v1,i1}
    \fmf{boson,f=(1,,0,,0),
         label=\color{myred}$\gamma$}{v1,v2} % override default text color
    \fmf{fermion}{o2,v2,o1}
    \fmfv{d.sh=circle,d.si=4}{v1} % override default text color
    \fmfv{d.sh=circle,d.si=4,f=(1,,0,,0),
          label=\color{myred}$\alpha$}{v2} % override default text color
    \fmflabel{e$^+$}{i1}
    \fmflabel{e$^-$}{i2}
    \fmflabel{$q$}{o1}
    \fmflabel{$\overline{q}$}{o2}
  \end{fmfgraph*}
\end{fmffile}
} % close \fmfframe
\end{document}
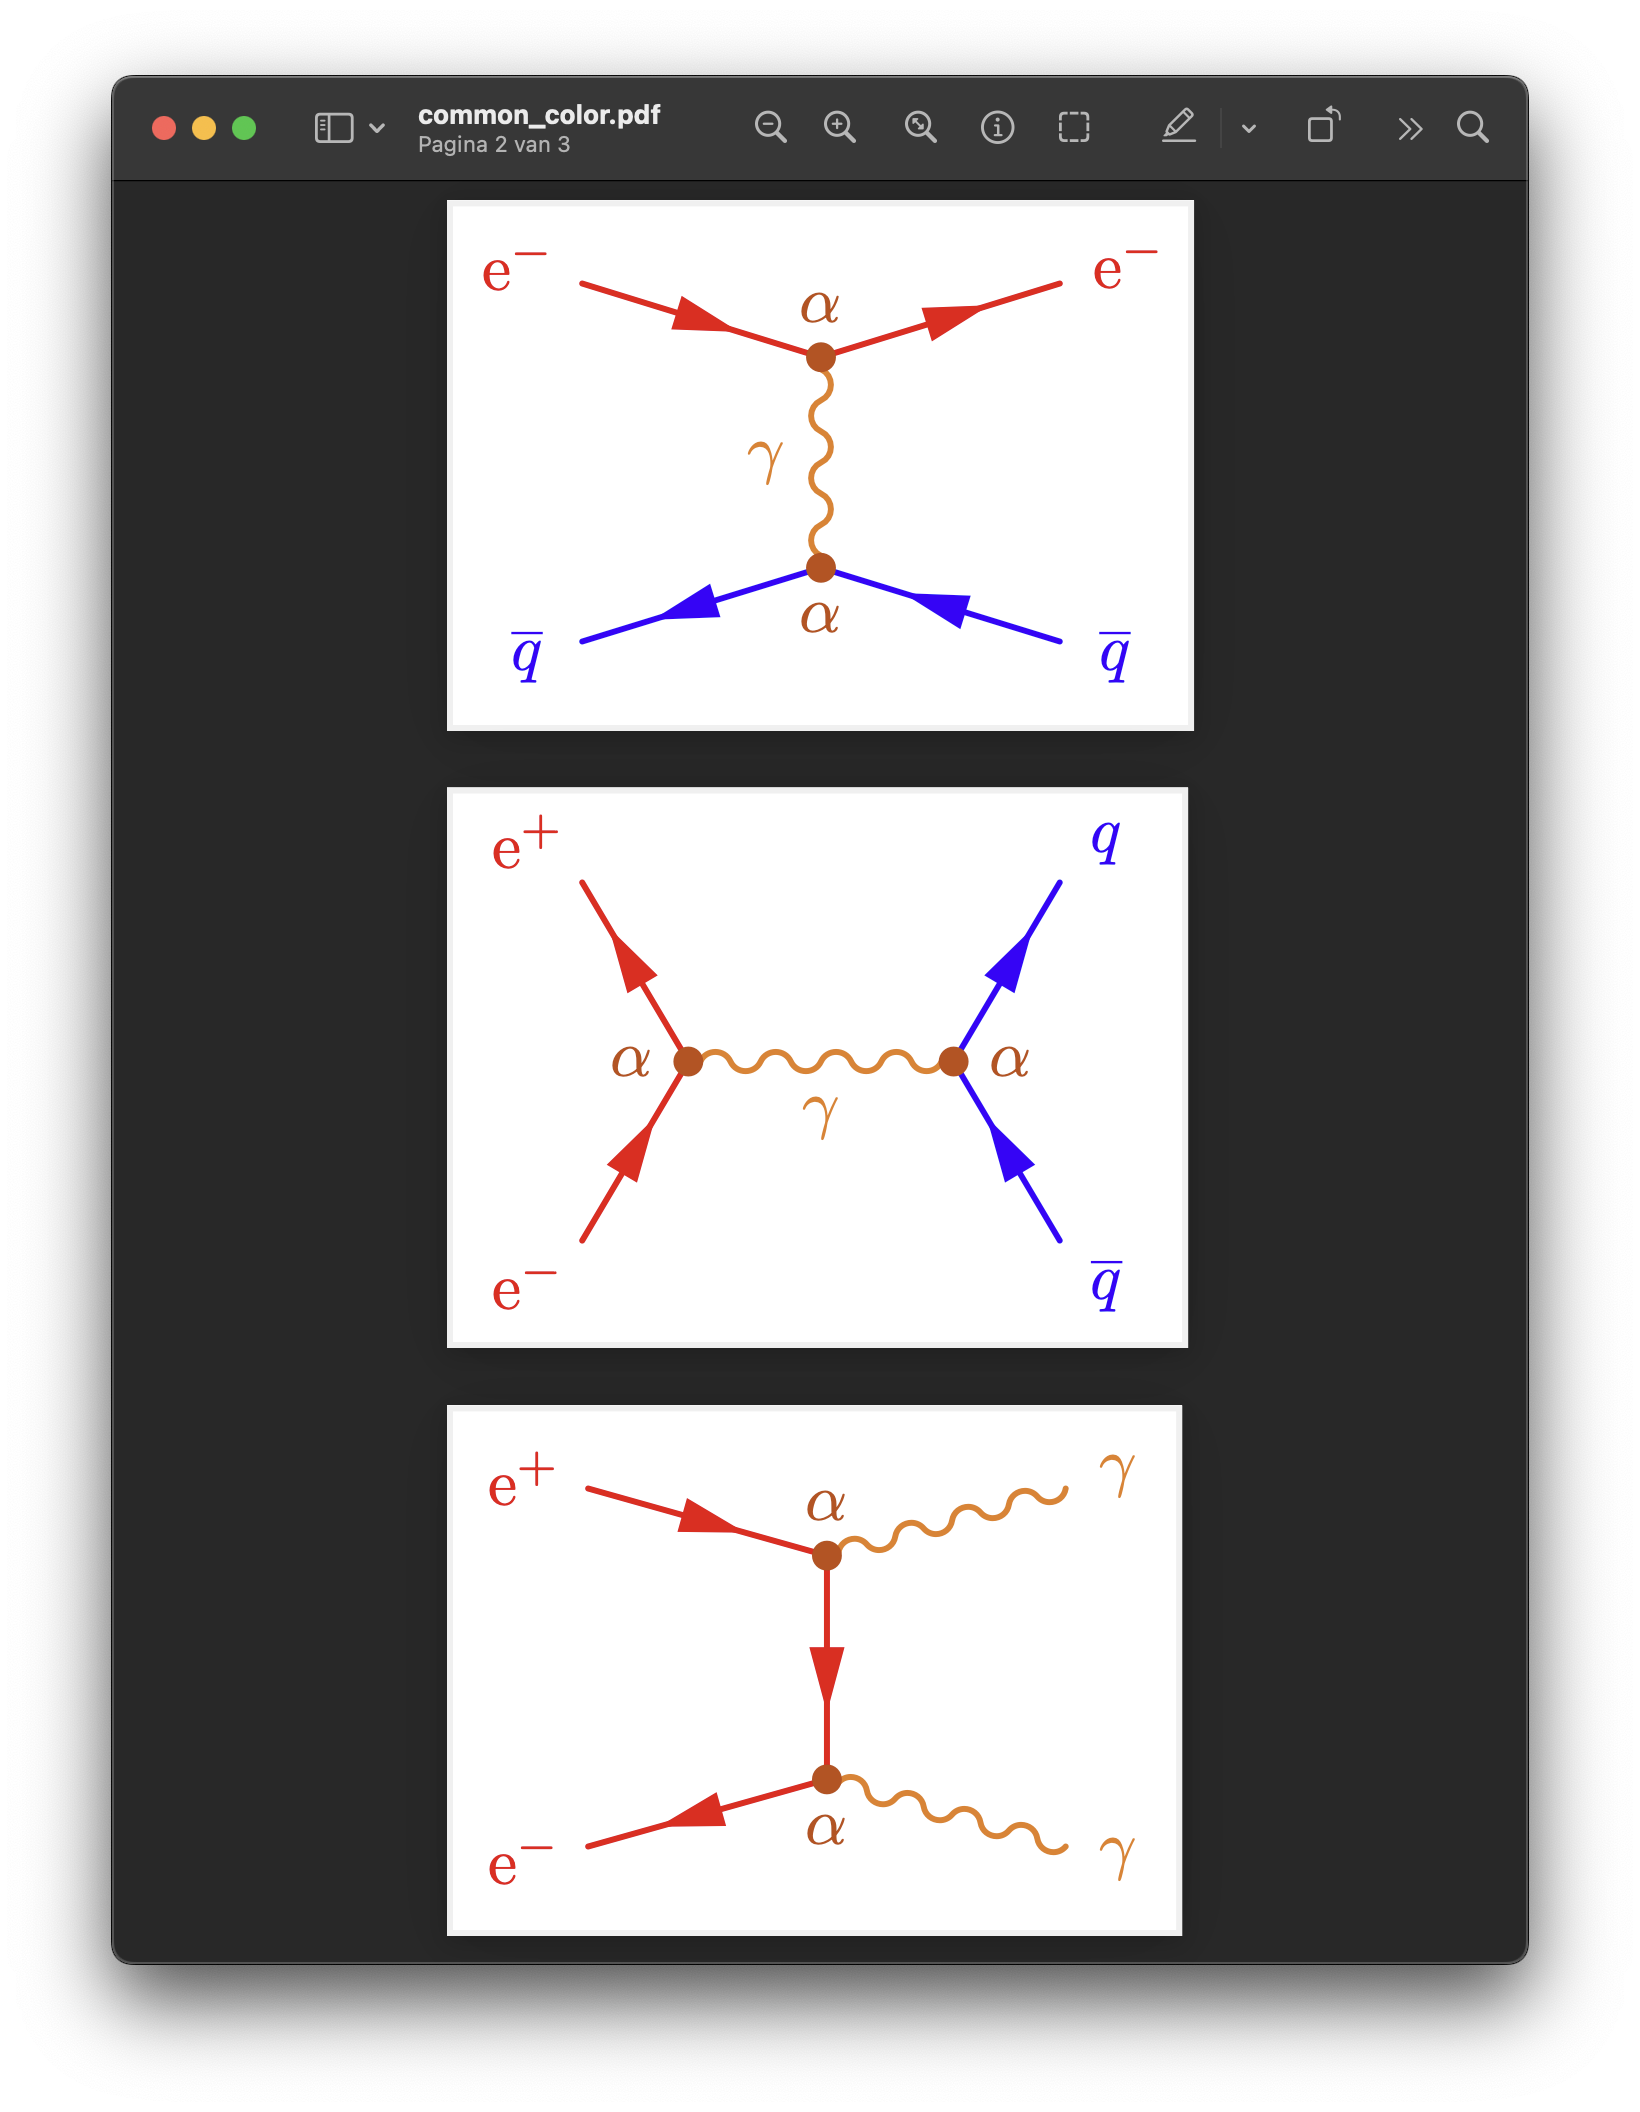
Common line and text color
The compilation tutorial explains how one can create a LaTeX file with multiple standalone Feynman diagrams that are compiled into a single multipage PDF. This is useful if you like everything in one place, where you can easily maintain many variations with some common settings like line colors and styles. On this website you find many such examples, like these diagrams for Higgs production.
The previous sections showed how you can define named line colors in MetaPost, as well as named text using the xcolor package. It would be nice to automatically create the line colors from the text colors to avoid double work. This can be achieve by adding the following lines in the preamble.
% DEFINE TEXT COLORS
\usepackage{xcolor}
\definecolor{colquark}{rgb}{0,0,1} % blue
\definecolor{collepton}{rgb}{1,0,0} % red
\usepackage{xcolor}
\definecolor{colquark}{rgb}{0,0,1} % blue
\definecolor{collepton}{rgb}{1,0,0} % red
% DEFINE METAPOST COLORS
\usepackage{pgffor} % for \foreach
\def\MPcolors{} % MetaPost code importing xcolor names
\foreach \colname in {colquark,collepton}{ % create command & MetaPost code
\convertcolorspec{named}{\colname}{rgb}\tmprgb % get rgb code
\xdef\MPcolors{\MPcolors color \colname; \colname := (\tmprgb); } % add color name
}
We loop over a given list of colors. In each iteration, we retrieve the normalized RGB code of a given named color with \convertcolorspec, and use it to prepare a piece of code that defines a color in MetaPost with the same name and RGB color. This gets added to the macro \MPcolors, which we add in the beginning of each fmffile block.
The full code would be something like this:
% !TEX program = pdflatexmk
% !TEX parameter = -shell-escape
% Author: Izaak Neutelings (March 2025)
% Instructions: To compile via command line, run the following twice
%   pdflatex -shell-escape common_colors.tex
\documentclass[11pt,border=4pt,multi=page,crop]{standalone}
\usepackage{feynmp-auto}

% DEFINE TEXT COLORS
\usepackage{xcolor}
\definecolor{colquark}{rgb}{0,0,1} % blue
\definecolor{collepton}{rgb}{1,0,0} % red
\definecolor{colphoton}{rgb}{.9,.5,.1} % orange
\definecolor{colvertex}{rgb}{.75,.3,.05} % dark orange

% DEFINE COLOR MACROS
% The following loops over the user color names and defines
% a handy \<colname> command to set text color, as well as
% defines colors in MetaPost of the same and value for lines
\usepackage{pgffor} % for \foreach
\def\MPcolors{} % MetaPost code importing xcolor names
\foreach \colname in {colquark,collepton,colphoton,colvertex}{ % create command & MetaPost code
  \expandafter\xdef\csname\colname\endcsname{\noexpand\color{\colname}} % \newcommand\<colname>
  \convertcolorspec{named}{\colname}{rgb}\tmprgb % get rgb code
  \xdef\MPcolors{\MPcolors color \colname; \colname := (\tmprgb); } % add color name
}

% DEFINE fmfpicture ENVIRONMENT
% The following defines a custom picture environment that
% helps to create standalone pages with common settings,
% and correctly padding the diagram with \fmfframe
\usepackage{environ} % for \NewEnviron
\NewEnviron{fmfpicture}[3]{%
  \begin{page}% to create standalone page
  \fmfframe(#1)(#2){% padding (LT)(RB)
  \begin{fmffile}{feynmp-#3}% auxiliary files (use unique name!)
    \fmfset{wiggly_len}{12} % boson wavelength
    \fmfset{wiggly_slope}{65} % boson slope of waves
    \fmfcmd\MPcolors % define custom line colors in MetaPost
    \BODY % main code
  \end{fmffile}
  }% close \fmfframe
  \end{page}
}

\begin{document}

% DIAGRAM 1
\begin{fmfpicture}{5,10}{5,11}{diagram1} % padding (LTRB)
  \begin{fmfgraph*}(100,60) % dimensions (WH)
    % external vertices
    \fmfleft{i2,i1}
    \fmfright{o2,o1}
    % main
    \fmf{fermion,f=collepton}{i1,v1,o1}
    \fmf{boson,t=0.7,f=colphoton,l.s=right,
         label=\colphoton$\gamma$}{v1,v2} % t-channel
    \fmf{fermion,f=colquark}{o2,v2,i2}
    % vertices
    \fmfv{d.sh=circle,d.si=4,f=colvertex,
          label=\colvertex$\alpha$}{v1}
    \fmfv{d.sh=circle,d.si=4,f=colvertex,
          label=\colvertex$\alpha$}{v2}
    % labels
    \fmfv{l.a= 160,l.d=5,l=\collepton\strut e$^-$}{i1}
    \fmfv{l.a=-160,l.d=7,l=\colquark $\overline{q}$}{i2}
    \fmfv{l.a=  20,l.d=6,l=\collepton\strut e$^-$}{o1}
    \fmfv{l.a= -20,l.d=7,l=\colquark$\overline{q}$}{o2}
  \end{fmfgraph*}
\end{fmfpicture}

% DIAGRAM 2
\begin{fmfpicture}{5,12}{4,14}{diagram2} % padding (LTRB)
  \begin{fmfgraph*}(100,60) % dimensions (WH)
    % external vertices
    \fmfleft{i2,i1}
    \fmfright{o2,o1}
    % main
    \fmf{fermion,f=collepton}{i2,v1,i1}
    \fmf{boson,t=0.8,f=colphoton,l.s=right,
         label=\colphoton$\gamma$}{v1,v2} % s-channel
    \fmf{fermion,f=colquark}{o2,v2,o1}
    % vertices
    \fmfv{d.sh=circle,d.si=4,f=colvertex,
          label=\colvertex$\alpha$}{v1}
    \fmfv{d.sh=circle,d.si=4,f=colvertex,
          label=\colvertex$\alpha$}{v2}
    % labels
    \fmfv{l.a= 140,l.d=4,l=\collepton e$^+$}{i1}
    \fmfv{l.a=-140,l.d=4,l=\collepton e$^-$}{i2}
    \fmfv{l.a=  30,l.d=6,l=\colquark$q$}{o1}
    \fmfv{l.a= -30,l.d=6,l=\colquark$\overline{q}$}{o2}
  \end{fmfgraph*}
\end{fmfpicture}

% DIAGRAM 3
\begin{fmfpicture}{6,10}{2,11}{diagram3} % padding (LTRB)
  \begin{fmfgraph*}(100,60) % dimensions (WH)
    % external vertices
    \fmfleft{i2,i1}
    \fmfright{o2,o1}
    % main
    \fmf{fermion,f=collepton}{i1,v1}
    \fmf{fermion,f=collepton}{v2,i2}
    \fmf{fermion,t=0.6,f=collepton}{v1,v2} % t-channel
    \fmf{boson,f=colphoton}{v1,o1}
    \fmf{boson,f=colphoton}{v2,o2}
    % vertices
    \fmfv{d.sh=circle,d.si=4,f=colvertex,
          label=\colvertex$\alpha$}{v1}
    \fmfv{d.sh=circle,d.si=4,f=colvertex,
          label=\colvertex$\alpha$}{v2}
    % labels
    \fmfv{l.a= 160,l.d=5,l=\collepton e$^+$}{i1}
    \fmfv{l.a=-160,l.d=5,l=\collepton e$^-$}{i2}
    \fmfv{l.a=  20,l.d=6,l=\colphoton$\gamma$}{o1}
    \fmfv{l.a= -20,l.d=6,l=\colphoton$\gamma$}{o2}
  \end{fmfgraph*}
\end{fmfpicture}

\end{document}
Note that in the above, because I am lazy, I want to shorten \color{colquark} to a command \colquark. To accomplish this, I use
  \foreach \colname in {colquark,collepton}{

    \expandafter\xdef\csname\colname\endcsname{\noexpand\color{\colname}}

  }
If \colname has the string value colquark, this line is equivalent to
\xdef\colquark{\color{colquark}}
Note on choice of colors
Note that about 1 in 20 people have some form of color blindness. Avoid using red and green together in an image if you want to make your work accessible to more people. Online you can find many suggested palettes that friendly for those with color vision deficiency (CVD). You can for example use one of the palettes suggested by Matthew Petroff in arXiv:2107.02270v2, which are available this GitHub repository.

")


")
